The electricity meter has been installed, automation is up and running, and the dashboard updates every day. Yet, when you ask the plant manager why this month's electricity bill increased by over a hundred thousand, the answer you get is "production was higher."
So, what is the exact electricity cost per ton of product? What is the difference between Plant A and Plant B? Which production line should be subject to a cost review? We can help your team answer these questions.




Electricity meter data reflects the operational status of each production line in real time. Which line is running, which line has stopped, and how much the load is can be known just by looking up, without waiting for daily reports.
The layout and color scheme are designed together with the brand. This wall is an internal management tool, and externally, it is the first thing customers see when they walk in.
About Your Site
Energy indicators are presented alongside fire safety point statuses. Power consumption, green energy percentage, carbon emissions, plus the real-time status of fire safety equipment can all be viewed on a single screen.
Fire protection systems can be integrated and displayed together, eliminating the need to prepare two sets of screens and two systems just to monitor both aspects.
Highly flexible meter hierarchy settings
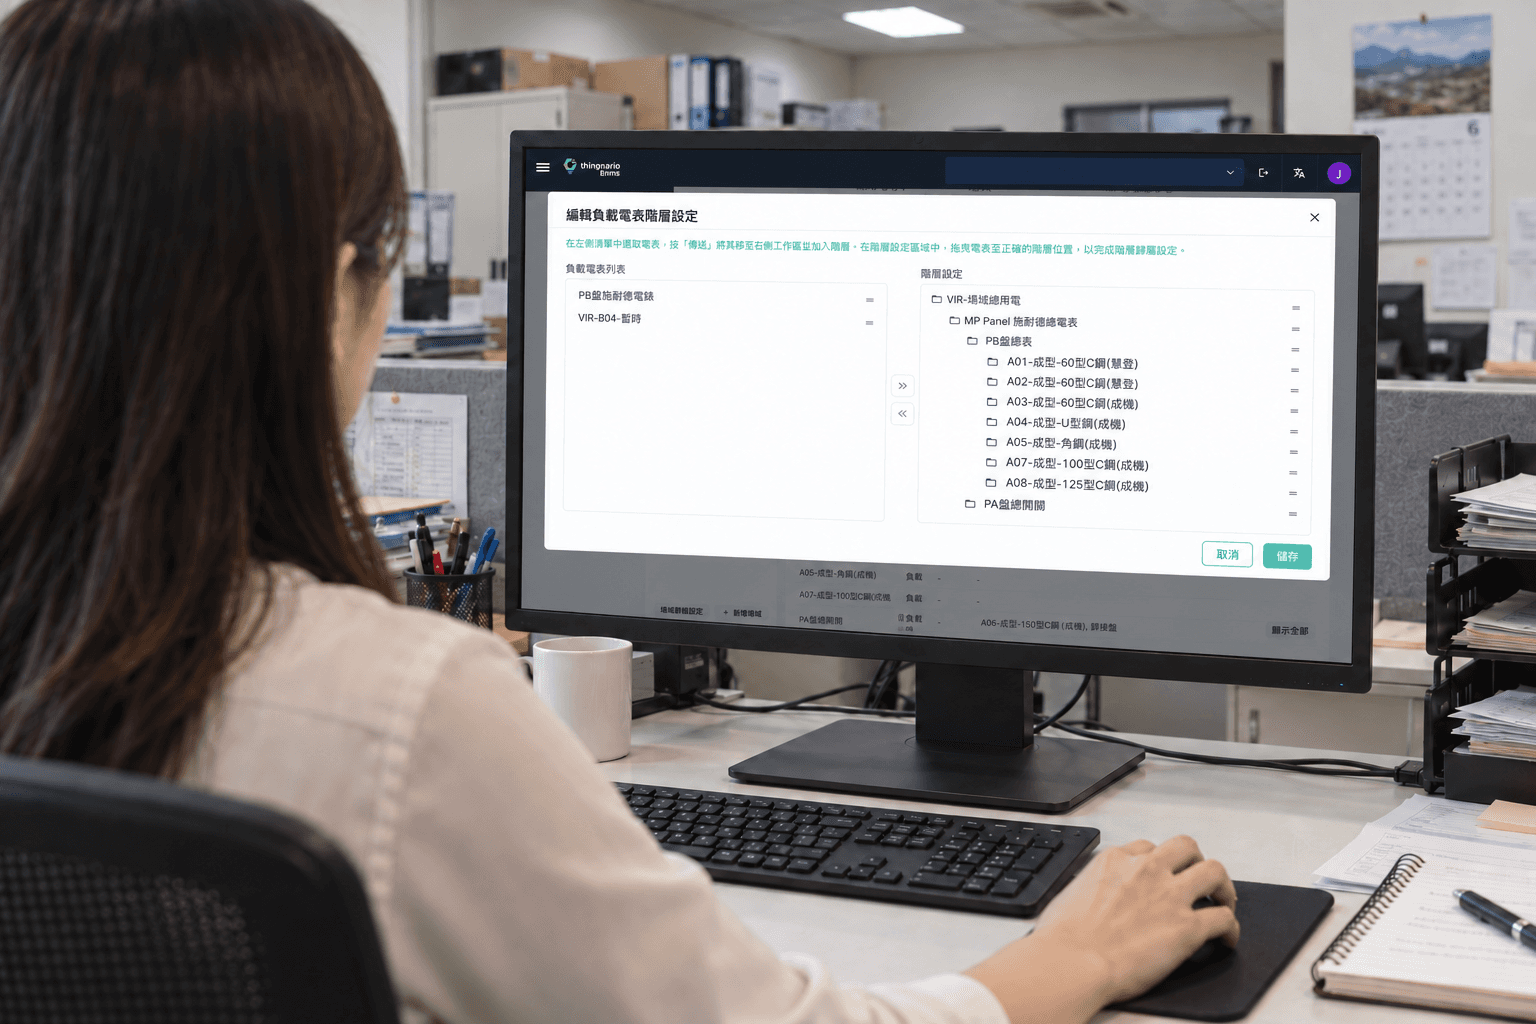
After the electricity meters are built into a hierarchy, the data can be broken down by production line and by area. How much electricity this production line used this month, what percentage of the entire factory's usage it represents, and what the converted cost is—these numbers can be generated directly.
There is no need to integrate production line systems, nor is there a need to alter existing production management processes. Once the meters are connected and the hierarchy is established, preliminary results can be obtained to support decision-making.
If you want to take it a step further and map energy to output—the energy cost per ton, per piece, or per batch—we can customize capacity analysis reports based on your calculation methods and automatically email your reports to your inbox at fixed intervals.
Set a Duration for Each Condition to Avoid False Alarms
Every condition can have its own duration, so you avoid alert fatigue. For example, an alert triggers only when power stays above 1,500 kW for two minutes, so a brief spike never becomes a notification. Events are also graded low, medium or high, so what matters doesn't get buried in noise.
Mobile App and Email Alerts, or Integration with Your Existing Systems
Email and mobile app alerts go straight to the right people once configured. Need them in your own system? We also support webhook integration.
EUI
Energy use per unit floor area, a common baseline for comparing across sites and years.
RE Share
Renewable energy share, aligned with client and regulatory requirements.
Carbon Emissions
The figures you need for carbon reporting and disclosure.
COP、kW/RT
Chiller efficiency, with any drop visible in real time.